
Attack of the Macs?! Migrating from GitHub Pages to Caddy
GitHub Pages has served this site well. It was easy to configure an automatic deployment action to publish my site as soon as I pushed a code change. It was also straightforward to point my domain to the server running my page.
However, I wanted to know more about how my site was being used. How many people visited the site and read my posts? How much computer resources was my site using? GitHub Pages does not reveal this information.
The time has come to move this site to a different location; one that gives me more control and visibility on how my software is run. Today I’ll share where I moved my site, the web server I chose to run, and how I monitor my website.
Which VPS to use?
There are a lot of options when it comes to choosing a Virtual Private Server (VPS). I used GetDeploying to compare options. There are a few things that I’m looking for when it comes to a server.
- Low cost
- Good variety of machine options
- Good operating systems
| Provider | vCPUs | RAM (GB) | Cost / month |
|---|---|---|---|
| Hetzner (CX22) | 2 | 4 | ~$4 |
| DigitalOcean (Basic droplet) | 1 | 0.5 | $4 |
| AWS (t2.micro) | 1 | 1 | Free tier eligible |
I initially was interested in Hetzner, due to the low cost per month, and surprising resources for a machine. For about $4 to $5 per month, I could rent a system with 2 vCPUs and 4GB of RAM, which was a lot of resources compared to other options!
However, it’s pretty irresistible to try an option that is free to get things up and running. I chose AWS for this process.
Which web server to use?
I considered tried and tested methods including Apache HTTP Server or Nginx, but I was interested with Caddy’s promise of automatic TLS certificate configuration. Additionally, Caddy’s configuration file made sense in my mind, so I went with this.
Caddy server configuration
The Caddy web server uses a Caddyfile for configuration. Caddy’s documentation can be found here.
Since my web server is simple, there isn’t much going on, but this is a nice introduction to how Caddy works. You can also see my Caddy configuration file in this site’s repository.
nickspatties.com, www.nickspatties.com {
	root * /var/www/html
	file_server
	encode gzip

	log {
		output file /var/log/caddy/access.log
	}
}
Here’s an explanation of the directives in this file.
- The domains at the top of the block indicate the following settings should apply for those domains.
rootdefines where Caddy should look for resources depending on the request. Here, any request (*) will look within the/var/www/htmldirectory for a matching resource.file_servertells Caddy to act as a static file server.encode gzipenables Gzip compression for all requested assets.- The
logblock tells Caddy to output access logs to a file at the location/var/log/caddy/access.log. Log files are rotated by default to keep disk space from accumulating.
Testing the server with Docker
This was a good time to use Docker to containerize the environment. The Dockerfile I created primarily ran the Caddy server to test its configuration. It’s extremely brief.
FROM caddy:2-alpine
COPY dist/ /var/www/html
COPY Caddyfile /etc/caddy/Caddyfile
EXPOSE 80 443
Here’s what this Docker image does:
- Pulls the
caddy:2-alpineimage to my machine to use as a base. - Copies the contents of the
distdirectory containing all my site’s minified assets, and places it in the/var/www/htmldirectory. This means I’ll need to runpnpm buildbefore building and running this docker image. - Copies the
Caddyfilefrom this directory to/etc/caddy/Caddyfile. This is the expected location for Caddy’s configuration file. - Exposes the ports
80and443of the container, allowing access to the web server.
To build and run the image, I defined a couple package.json scripts to simplify the process.
"scripts": {
  // ...
  "docker:build": "docker build -t portfolio-site-caddy .",
  "docker:run": "docker run -p 80:80 -p 443:443 portfolio-site-caddy"
}
After running these commands, I could access my site by navigating to localhost, and analyze the logs from within the docker container as I moved from page to page.
Running Caddy in a Docker container before committing to running it on a VPS helped me familiarize myself with it. I recommend using containerized environments when experimenting with different web servers.
Migrating to AWS
Once I felt comfortable with my configuration, I was ready to move my site. First thing I needed was to provision my hardware:
- Log into my root user account
- Launch a new t2.micro EC2 instance with Ubutnu Server 22.04 LTS
I daily drive Ubuntu, so the consistency between my local and server environment simplified my development.
After some time, my micro Ubuntu machine was ready to use, so I logged in via SSH, and started installing Caddy by following these instructions.
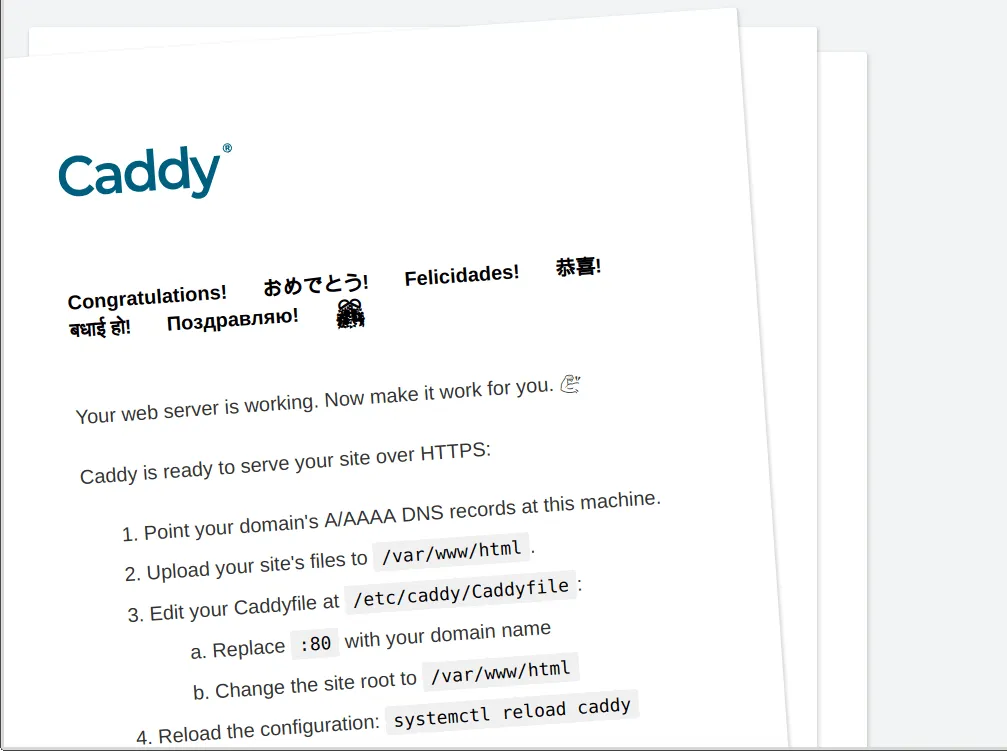
Once installation is complete, the Caddy server will automatically start running. If I visit the Public IPv4 DNS assigned to my EC2 instance, then the default Caddy server message will appear!
Moving my files to the server
Once my built files are moved to the server, then I’ll be able to see the site again. I did so by using scp, or the “Secure Copy” command.
scp -i {{private-key}} -r dist/ {{user}}@{{host}}:{{location}}
-i {{private-key}}means use thisprivate-keyfor authentication. AWS provides you with a permission token to access your server.-rmeans recursively copydist/is the directory where my built site is located{{user}}@{{host}}:{{location}}is the location
Remembering this specific command is a pain, but it’s possible to configure SSH for simpler logins, which scp uses under the hood.
Host aws-t2micro
  HostName {{host}}
  User {{user}}
  IdentityFile {{private-key}}
  IdentitiesOnly yes
This simplifies the command as follows:
scp -r dist/ aws-t2micro:~
Once complete, I logged into my server via SSH to manually move my files from the home directory to the appropriate /var/www/html location.
Double-checking the logs
Hoping that automatic HTTPS was working as intended, I wanted to check Caddy’s logs to see if everything was OK. Since Caddy is a systemd unit, we’ll use journalctl to do so.
journalctl -u caddy
-ufetches logs for a specific unit. In this case,caddy
The logs contain some output that looks like this:
Aug 27 23:50:28 i-0c5db664656540b4b caddy[339]: {"level":"info","ts":1724802628.2614427,"logger":"tls.issuance.acme.acme_client","msg":"got renewal info","names":["www.nickspatties.com"],"window_start":1729897886.3333333,"window_end":1730070686.3333333,"selected_time":1729927437,"recheck_after":1724824228.2614372,"explanation_url":""}
Aug 27 23:50:28 i-0c5db664656540b4b caddy[339]: {"level":"info","ts":1724802628.3390296,"logger":"tls.issuance.acme.acme_client","msg":"got renewal info","names":["www.nickspatties.com"],"window_start":1729897886.3333333,"window_end":1730070686.3333333,"selected_time":1730056792,"recheck_after":1724824228.339024,"explanation_url":""}
Aug 27 23:50:28 i-0c5db664656540b4b caddy[339]: {"level":"info","ts":1724802628.3390749,"logger":"tls.issuance.acme.acme_client","msg":"successfully downloaded available certificate chains","count":2,"first_url":"https://acme-v02.api.letsencrypt.org/acme/cert/03804a98a06c1f5d6a108ca53b636046ad87"}
Aug 27 23:50:28 i-0c5db664656540b4b caddy[339]: {"level":"info","ts":1724802628.3395047,"logger":"tls.obtain","msg":"certificate obtained successfully","identifier":"www.nickspatties.com","issuer":"acme-v02.api.letsencrypt.org-directory"}
Notice the messages? The "msg" attribute of these logs shares that certificate renewal information was retrieved, and the certificate was obtained successfully! The server, and specifically automatic HTTPS, is working as expected.
Now that the assets have been copied, and the server is running, the site should be accessible! If you’re reading this right now, then that means thinks are working as expected.
But how well are things working? We can find out by analyzing CloudWatch metrics and the Caddy server’s access logs.
Analyzing usage with AWS CloudWatch
I’ve been using AWS CloudWatch to see these metrics. AWS does a good job of guiding users to what you need with step-by-step setup. Although sometimes the multitude of services feels like walking through a maze, creating a metrics dashboard for my EC2 instance was easy by comparison.
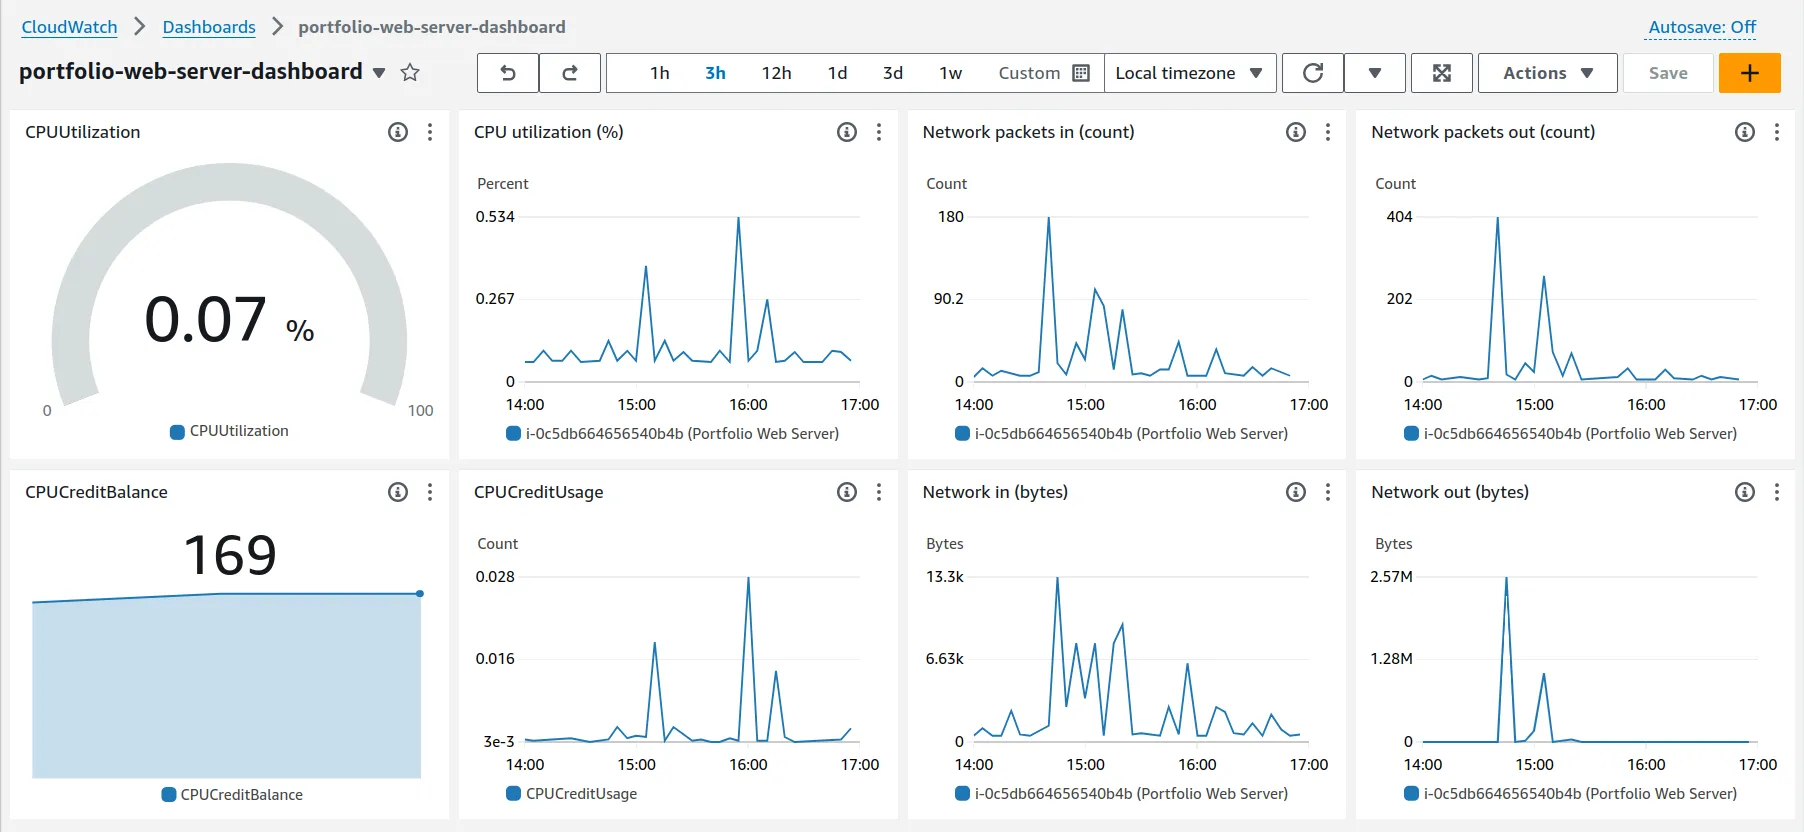
After setting my dashboard, I immediately noticed some things.
- Most of my CPU utilization occurs when I’m installing software. Packet traffic also correlates with this information. When installing
caddy, I used up about 40% of my CPU utilization. - There are small bumps in CPU utilization while running programs like
htopto monitor my server, while Caddy running at idle uses about a tenth of a percent of the CPU. - Since my EC2 instance burstable, meaning its performance can go beyond its limits, I accrue credits which control how much my instance can burst. I can see how I’m spending and accruing my credits to predict if I’ll run into a performance bottleneck at some point. At the moment, everything is good.
Analyzing access with goaccess
goaccess is a command line application that analyzes access logs. This allows me to quickly get a glimpse of how my site is being used. Recall these access logs are stored on the server, so I would need to either run goaccess on the server, or retrieve them. Given my resource limitations, I’ll retrieve the files instead.
You can use SSH to run a command on a server, but then print its output to a local machine. Given this, I can pipe the output to goaccess to analyze my traffic with one command.
ssh aws-t2micro -t sudo cat /var/log/caddy/access.log | \
  goaccess - --log-format=CADDY
-t {{command}} {{command params}}indicates the command that should be run on the server. In this case, I’m printing out the access logs withcat.--log-formatlets you assign the expected log format sogoaccesscan understand the logs.goaccesssupports Caddy logs out of the box!
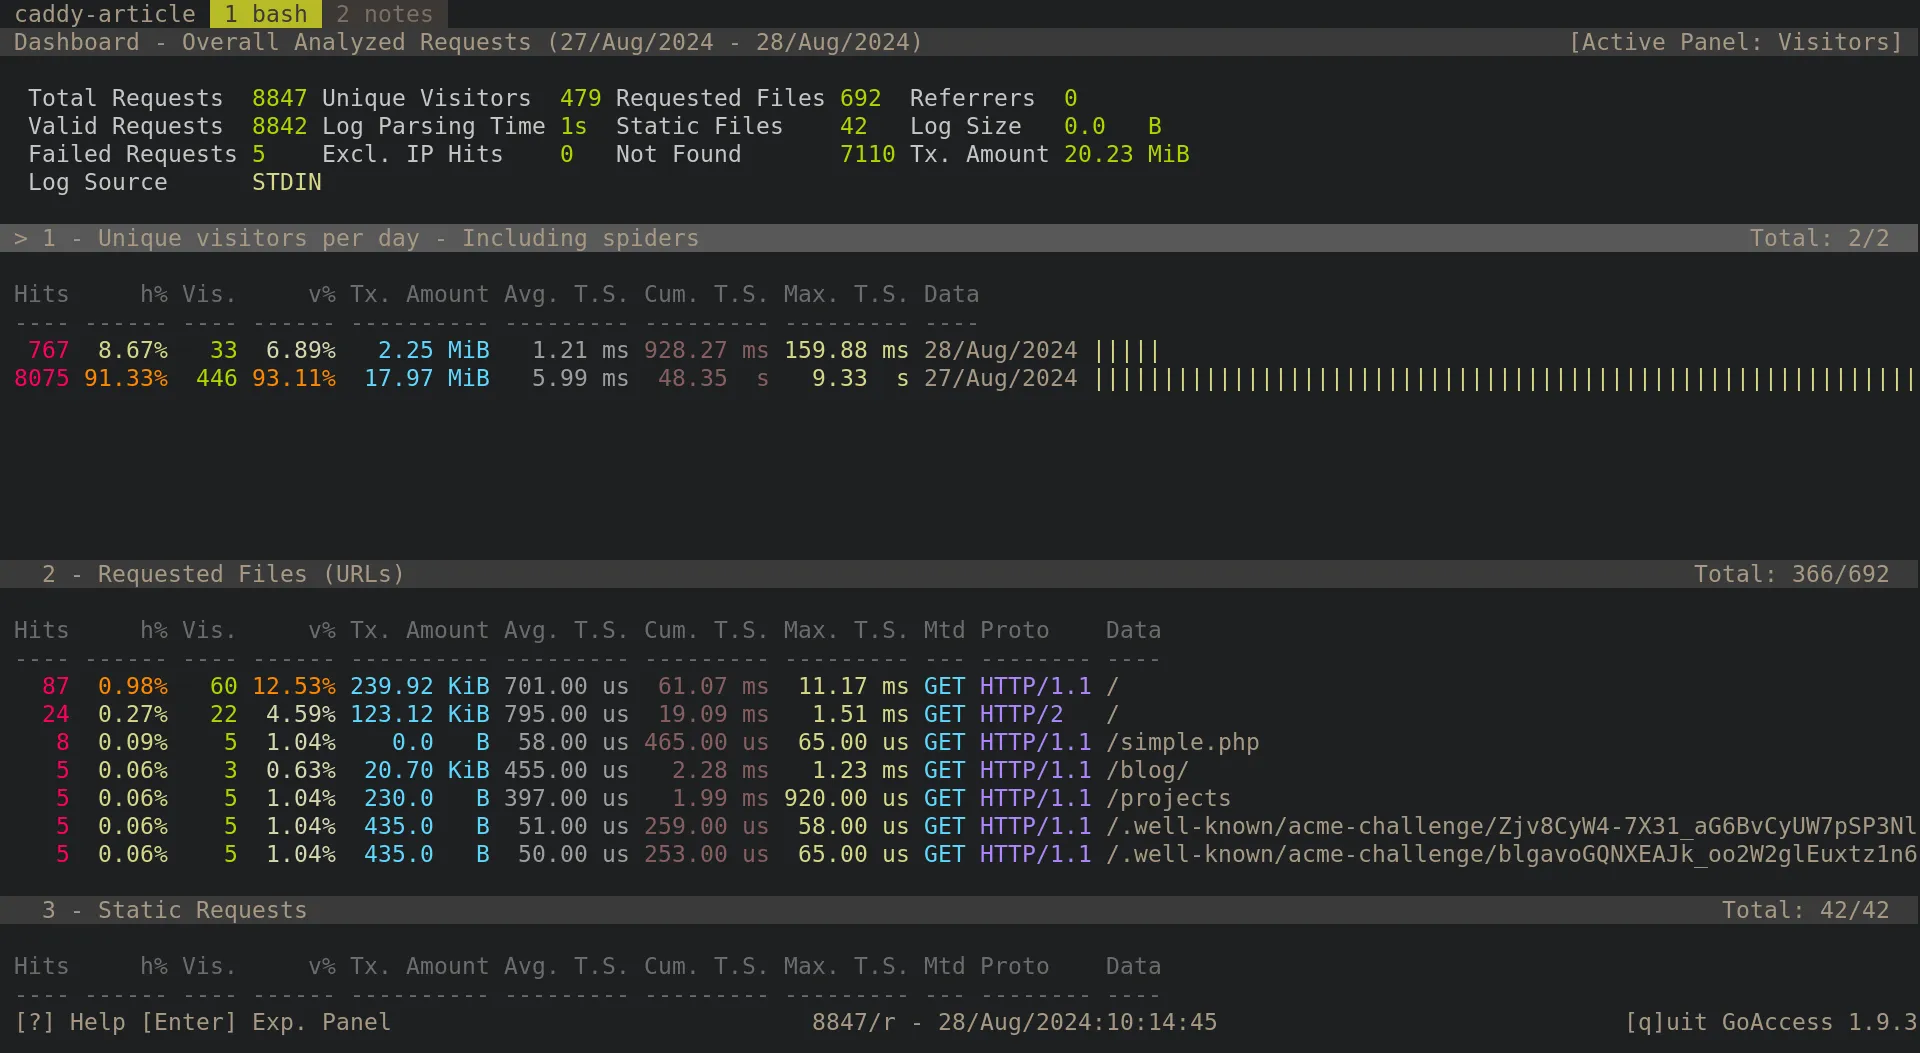
The output of the application looks something like this:
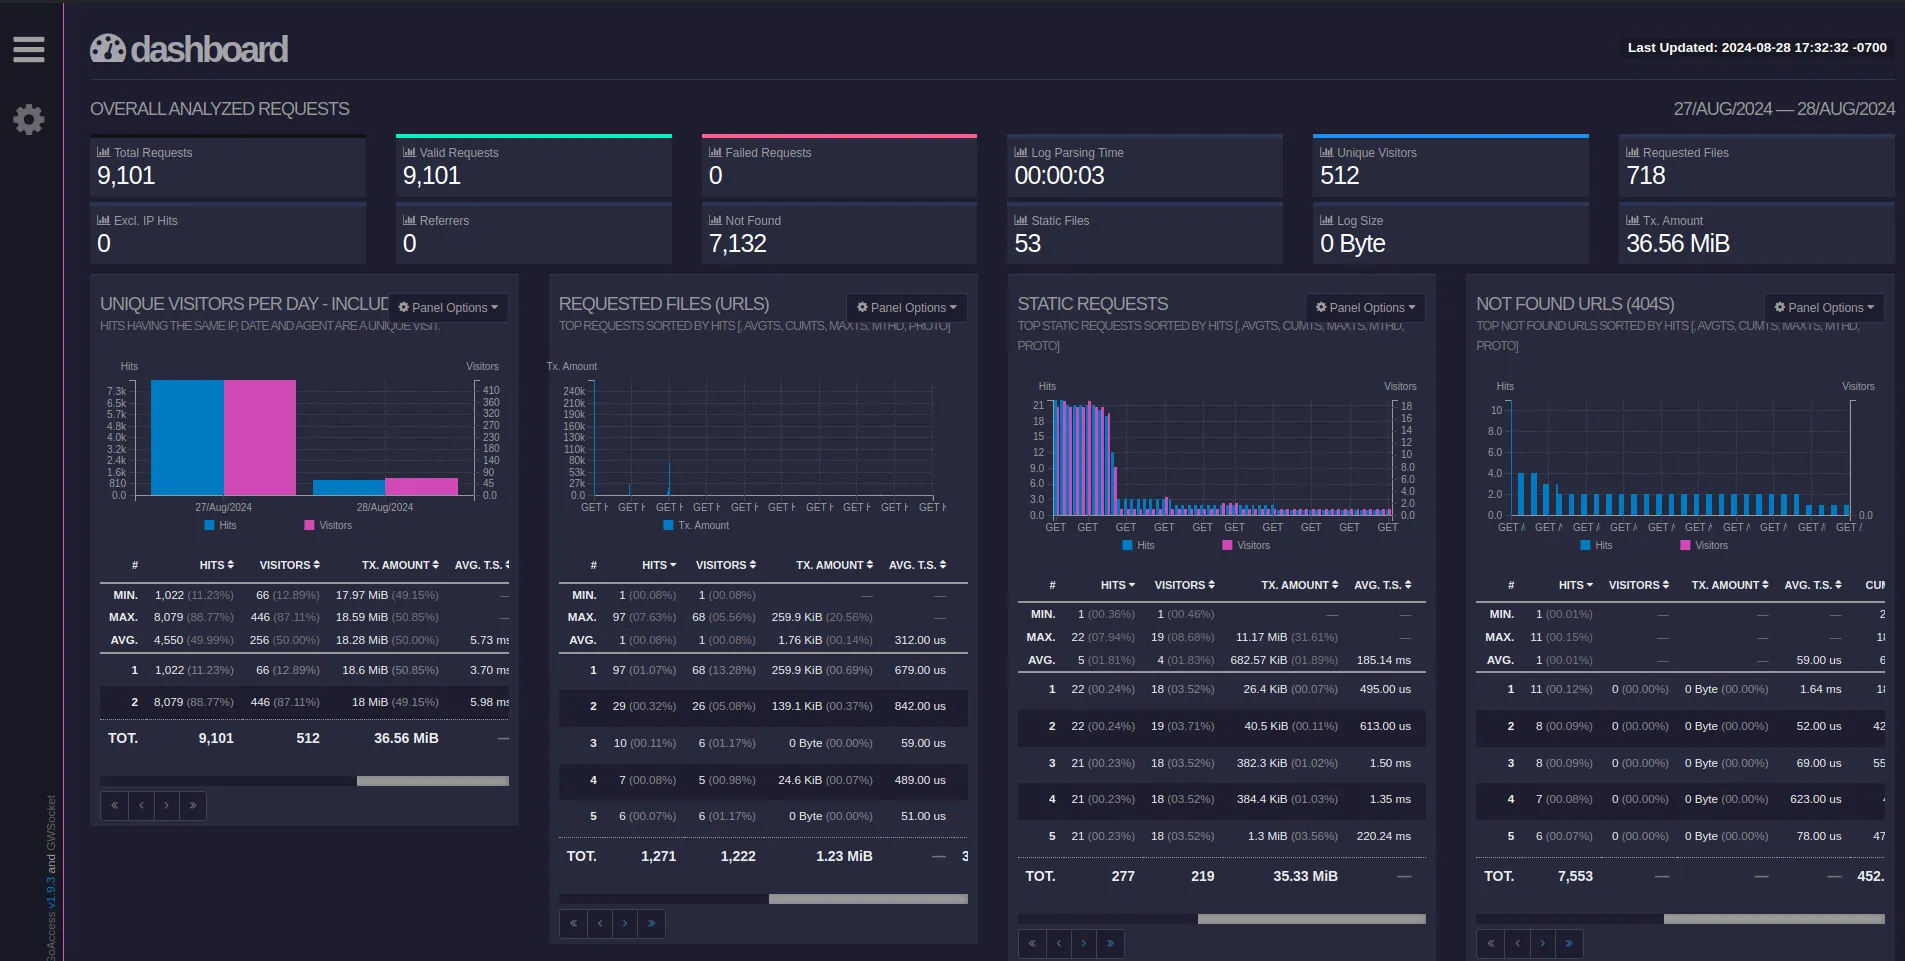
Additionally, if you wanted to view a dashboard, you can modify the goaccess command to output an HTML file:
goaccess - --log-format=CADDY -o metrics.html
Afterwards, you can open the metrics in your browser of choice, either by selecting it in a file browser, or with the command line. If you do use the command line, you could run a command that fetches access logs, creates an HTML file, and opens it in a browser like so:
ssh aws-t2micro -t sudo cat /var/log/caddy/access.log | \
  goaccess - --log-format=CADDY -o metrics.html && \
  brave-browser metrics.html
The resulting HTML template looks like this:
Interesting findings
Below are some interesting things I noticed while looking at the access logs for the new AWS hosted, Caddy run web server.
Macs are beating up my server?!
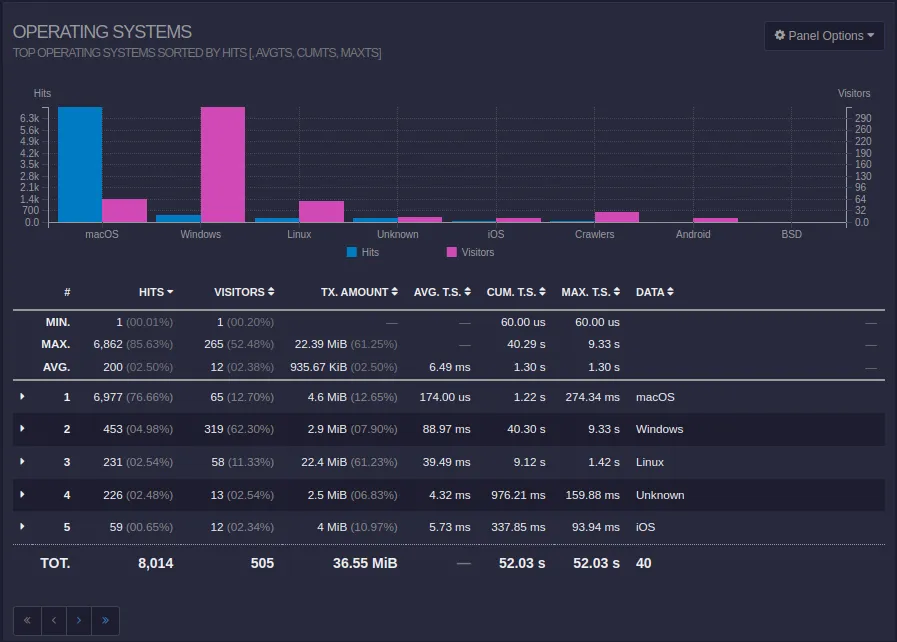
The operating system that hit my server the most times was macOS by an overwhelming margin. This occurred on August 27th, the day I started my server.
Interestingly enough, there was a massive spike in hits that came from a specific IP address: 54.156.54.46.
To find out more information about this IP address, we can use the whois command, which is a client that accesses a database containing IP addresses and their associated details.
whois 54.156.54.46
The output contains some interesting details:
OrgName:        Amazon Technologies Inc.
Address:        410 Terry Ave N.
City:           Seattle
StateProv:      WA
This is the address of the organization that owns this specific IP address. Additionally, there’s information about Network Operation Centers, or NOCs, within this entry.
OrgAbuseHandle: AEA8-ARIN
OrgAbuseName:   Amazon EC2 Abuse
OrgAbusePhone:  +1-206-555-0000
OrgAbuseEmail:  abuse@amazonaws.com
OrgAbuseRef:    https://rdap.arin.net/registry/entity/AEA8-ARIN
I suppose I can email abuse@amazonaws.com about the macOS systems hitting my system like a ton of bricks. Better not forget this information in the comments, though!
Comment:        All abuse reports MUST include:
Comment:        * src IP
Comment:        * dest IP (your IP)
Comment:        * dest port
Comment:        * Accurate date/timestamp and timezone of activity
Comment:        * Intensity/frequency (short log extracts)
Comment:        * Your contact details (phone and email) Without these we will be unable to identify the correct owner of the IP address at that point in time.
My guess is that there’s some automated system which identifies what kind of server I’m running. The fact that it occurred right when I started my Caddy server does give me pause. I’ll have to follow up and see what’s happening.
A problem with redirects?
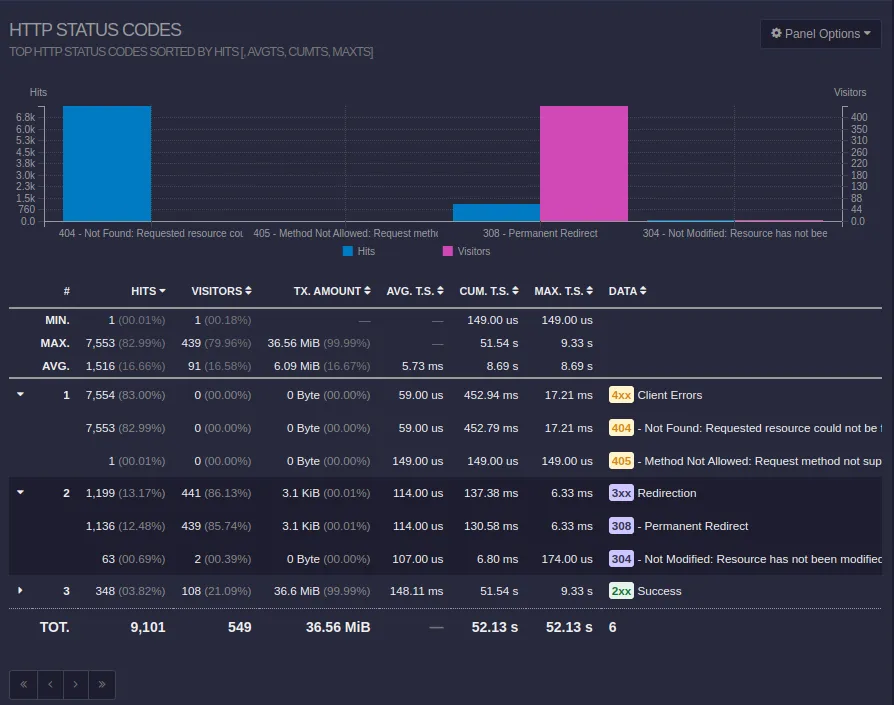
In the period of time since the site went up, 1199 hits were redirected. This seems like an issue. If someone was visiting the site, and clicking on links, then there shouldn’t be redirects taking place. The links should just point directly to the resource.
Upon further investigation, it appears it’s a problem with trailing slashes. When navigating to link without a trailing slash, the server will redirect to the same URL with a slash.
While this may seem like a non-issue for graphical browser users, this makes my logs very difficult to read, and it indicates I may have incorrectly configured my Caddy server. Here are the docs for the file_server Caddy directive:
By default, it enforces canonical URIs; meaning HTTP redirects will be issued for requests to directories that do not end with a trailing slash (to add it), or requests to files that have a trailing slash (to remove it).
This information would’ve been missed had I not had access logs to help me out.
404’d files?
This was actually easier to analyze with the goaccess CLI instead of the web view. I can easily scroll through these entries to see which files were being requested. Here’s an excerpt of requested resources sorted by number of requests.
/wp-includes/bak.php
/wp-admin/wp-login.php
/wp-includes/cloud.php
/wp-content/index.php
/readme.php
/wp-admin/about.php
/wp-content/themes/404.php
/wp-admin/index.php
/wp-content/themes.php
/wp-content/dropdown.php
/wp-includes/404.php
/wp-content/upgrade/index.php
There are a lot of WordPress related links. Perhaps some WordPress penetration testing was taking place on my server? If so, who was doing this?
Caddy logs are saved as JSON files, which means we can use a tool like jq to analyze the output. Here’s a command that returns a list of IP addresses that requested a /wp-admin link. We’ll even see sort, an old friend, which will filter unique outputs.
grep "/wp-admin" access.log | jq .request.remote_ip | sort -u

"13.74.113.25"
"193.37.32.1"
"213.232.87.234"
"45.141.215.69"
"52.164.126.26"
"54.156.54.46"
"85.203.21.155"
"85.203.21.159"
"85.203.21.176"
"85.203.21.178"
"85.203.21.183"
"85.203.21.184"
"85.203.21.197"
"85.203.21.201"
"85.203.21.206"
"85.203.21.207"
"85.203.21.223"
"85.203.21.227"
"85.203.21.238"
"85.203.21.239"
"85.203.21.240"
"85.203.21.246"
According to the list of IPs returned from that request, the organizations tied to machines that attempted to access the WordPress admin board on my site are…
- … Microsoft
- … Amazon
- … an IT company based in Panama City, Panama
- … a 1337 German company that sells privacy focused servers
- … a Dutch networking consulting company, and the person behind it
Feel free to find whois tied to these addresses yourself!
Visitors from other sites?
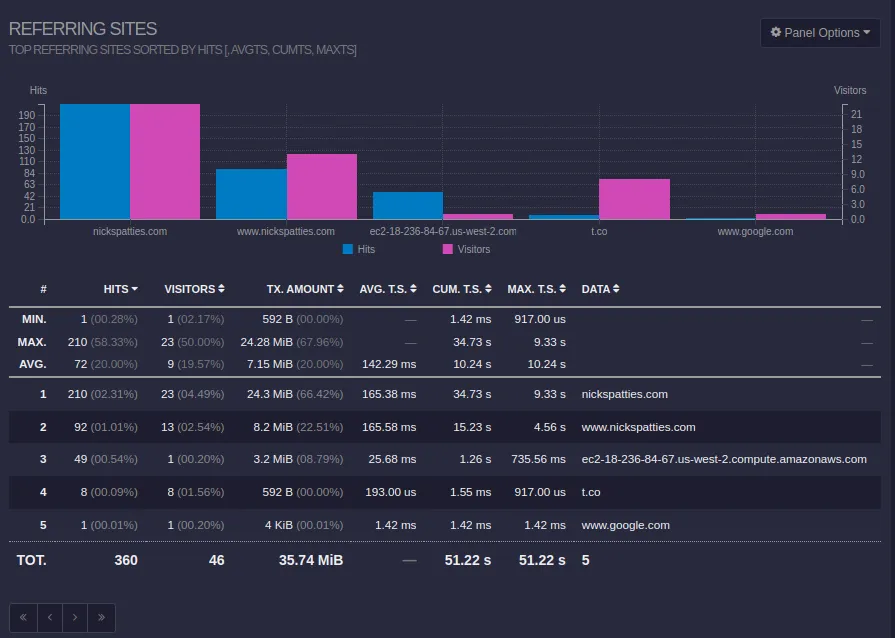
There are times when I post my blog to other sites, including LinkedIn and Twitter (now X). I can use these metrics to verify if posting on other platforms is worth the investment.
Conclusion
In a day of work, I now have actual insights in what’s going on with my server! Overall, I’m happy with the change! Here are some considerations I have for my server.
- I’m assuming that traffic for this site will not be stellar for the time being, but if more people visit, then there’s a chance I’ll be charged for my EC2 usage. Before I get charged too much, I’ll need to consider other options in case I need to jump ship.
- If I want to check for memory leaks in my application via the dashboard, then I need a way to record RAM utilization. Currently, this is not enabled for EC2 instances by default.
- It would be nice to automate deployments to my server again, so more research is required to see how that can be facilitated either via GitHub actions, or another approach. One solution is to create a script that updates my remote server, and then call it locally when I merge a pull request to main. More thought is required.
If you have a site that is on a hosting platform like GitHub Pages and would like more metrics like I did, I hope this information is useful to you! Have you used Caddy or something similar for your web servers? Enjoying a particular VPS provider? I’m happy to hear it!